What is a Good Digital Carbon Rating?
In this post, we explore how digital carbon ratings can help you measurably improve web sustainability.
Understanding the true energy and emissions impact of digital products like websites and mobile apps is challenging for many reasons. Here are a few:
- Internet ecosystem: The internet is a complex ecosystem with many system segments, each of which use energy and generate emissions. This makes it challenging to understand who is responsible for various impacts of their digital supply chain, especially when it comes to Scope 3 emissions. Plus, the amount of renewable energy in any given power grid changes all the time.
- Data practices: Meanwhile, free or low-cost tools make it easy to collect data. 90% of that data goes unused or is never properly disposed of. This undermines sustainable data strategies within organizations—not to mention data privacy—and makes data centers the virtual equivalent of landfills.
- Lack of skills: Very few digital professionals are trained or skilled in sustainability or responsible digital principles. Similarly, few sustainability professionals prioritize digital in their corporate sustainability and impact reporting initiatives.
- Measurement: Finally, there isn’t yet widespread consensus on the most effective methodology to calculate digital emissions.
Without meaningful data, trained professionals, or clear incentives, it becomes even more difficult for organizations to allocate resources to digital sustainability efforts. However, we’re in a climate emergency. The clock is ticking. We can’t afford neglect or delay.
When our friends at Wholegrain Digital—our partners on the Sustainable Web Design site—approached us about devising a digital carbon ratings system to help people take more meaningful action, we jumped at the chance to collaborate.
Digital Carbon Confusion
After adding digital emissions estimates to our free web sustainability tool Ecograder, we learned that people struggle to understand what to do with the information provided. We also learned that Wholegrain Digital faced similar challenges with Website Carbon.
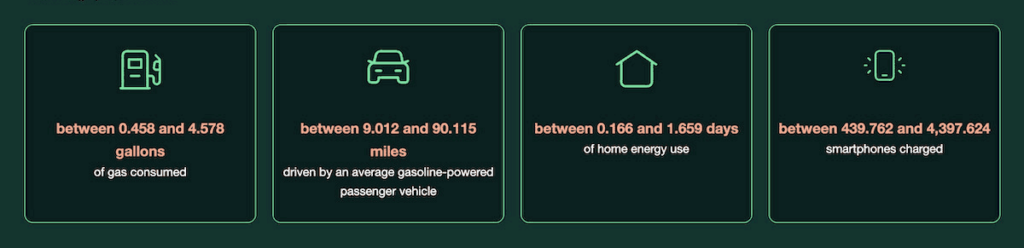
Sure, these tools and others provide equivalencies (see image above) meant to help people make meaningful comparisons. However, user feedback informed us that this data often didn’t inspire people to create the necessary change.
For example, as of this writing, the average emissions estimate of pages run through Ecograder is 1.241 grams of CO2 per page view. If someone asked you whether that number was good or bad, how would you answer?
In a rapidly warming world, we need more clarity around good digital sustainability practices. Digital carbon ratings can alleviate confusion.
What Constitutes a Good Digital Carbon Rating?
To ascertain how best to devise a ratings system, the team researched a number of factors and landed on three important criteria:
- Standardization: Ratings should adhere to common and widely accepted measurement and reporting standards.
- Scientific rigor: The system must incorporate scientific methods into measurable sustainability outcomes.
- Simplicity: Above all else, data provided should be easy for people who are new to this topic to understand and make actionable.
This criteria provided points of reference to create the ratings.
1. Standardization: Other Ratings Systems
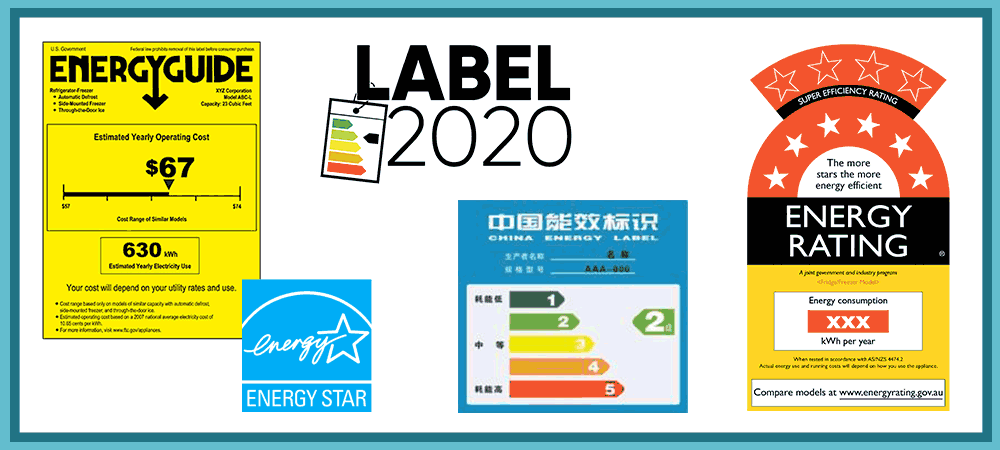
Thankfully, many other energy and sustainability rankings exist to help us define digital carbon ratings. In the U.S., EnergyStar ratings help people rank appliances and other electronic products. Similarly, the European Union has Label 2020. Many other countries offer similar solutions.
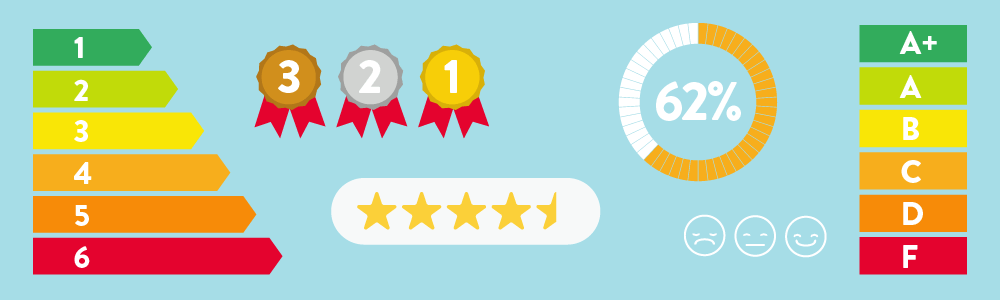
Generally, these systems break their ratings down into several common categories:
- Level-based rating systems: bronze, silver, gold, platinum, etc.
- Number-based systems: often scoring 1 to 10 or 100
- Star ratings: usually on a scale of one to four or five stars
- Color-based rating systems: red = bad, green = good, for example
- Grade-based rating systems: A through E or F, depending on which country you live in
Ecograder has featured a number-based scoring system since its initial launch in 2013. We know that people use this system to improve their score, and hence, their website. However, as noted above—even with emissions estimates included—the numbers aren’t always meaningful to users, especially those who are new to digital sustainability.
After reviewing many methods and approaches used by countries around the world, we eventually landed on a grade-based system. This led to its own set of challenges.
Terminology: Grading vs. Rating
For example, grading isn’t globally universal. While it’s commonly accepted that earning an ‘A’ is good and a ‘C’ is average, some countries use ‘E’ as a failing grade, while others use ‘F’. Plus, the Label2020 system mentioned above goes all the way up to ‘G’. ¯\_(ツ)_/¯
What might this mean for our own system? Will an ‘E’ grade confuse someone in a country that doesn’t recognize that as a failing grade? Do we need to go as high as ‘G’ or ‘H’ or will that cause even more confusion?
More importantly, can we afford average grades for carbon in the middle of a climate emergency?
This digital carbon rating system relies on a common academic grading framework that should be familiar to many. We opted to use the term rating over grading to align with other common models and, hopefully, make it easier for people to take meaningful action.
Grading vs. rating aside, we also needed to give this methodology the scientific rigor it requires for efficacy. For this, we turned to the HTTP Archive.
2. Scientific Rigor: Using HTTP Archive Data
The HTTP Archive is a permanent repository of web performance information such as size of pages, failed requests, and technologies utilized. This performance information allows us to see trends in how the Web is built and provides a common data set from which to conduct web performance research.
— HTTP Archive
The HTTP Archive tracks how the web is built. The organization regularly crawls a large subset of the web and uses this data to produce ongoing reports. For more information on how HTTP Archive data can be used to advance sustainability efforts, read the sustainability chapter of their annual web almanac.
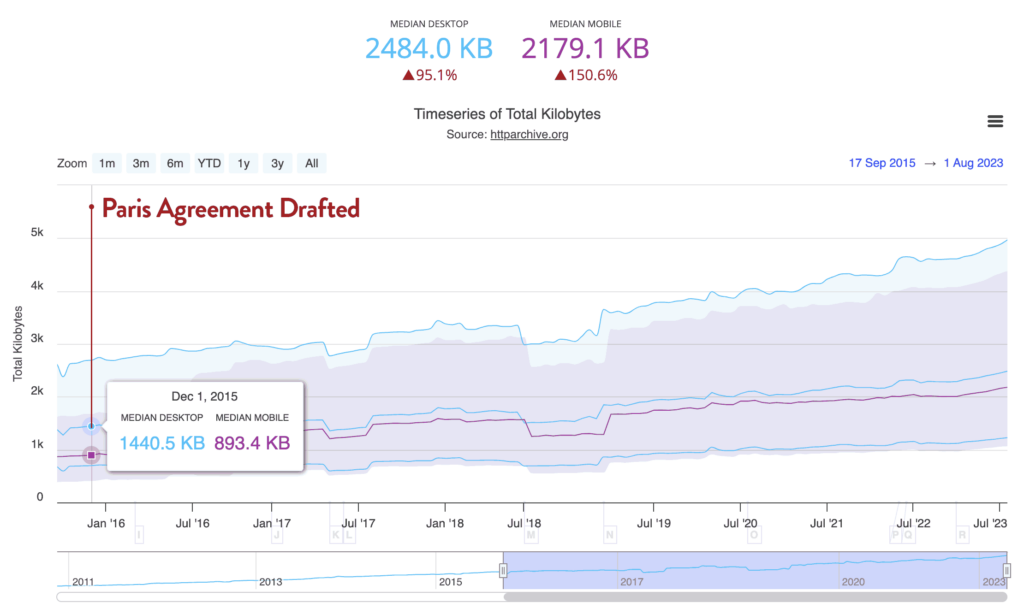
To craft meaningful digital carbon ratings, we used a dataset offered by the HTTP Archive on data transfer size (also known as page weight). Data transfer isn’t the only meaningful metric to estimate energy efficiency or digital emissions from websites. However, it is important.
Using their crawl data, the median data transfer size to load a webpage on a desktop device was 2449.4 kb. The mobile equivalent was 2157.7 kb. Understanding this, we asked ourselves how we might use this data to apply meaningful digital carbon ratings under our proposed system.
Here’s what we came up with:
| Rating | HTTP Archive Transfer Size (kb) | Grams CO2 Per Pageview |
|---|---|---|
| A+ | 272.51 (5%) | 0.09527737 |
| A | 531.15 (10%) | 0.18570539 |
| B | 975.85 (20%) | 0.34118537 |
| C | 1410.39 (30%) | 0.49311311 |
| D | 1875.01 (40%) | 0.65555770 |
| E/F | 2419.56 (50%) | 0.84594812 |
The system is intentionally aggressive. It also leads us to an unfortunate truth…
Most of the Web Will Fail This System
In a rapidly warming world, websites exceeding emissions represented by the average page size cannot be considered sustainable.
— Introducing Digital Carbon Ratings, Sustainable Web Design
With a pass/fail threshold set to match median webpage size, the majority of all sites on the World Wide Web will fail this new ratings system. Many will no doubt find this frustrating. However, it can also serve as a great catalyst for change.
At Mightybytes, we’ve historically hesitated to quantify specific page sizes for more ‘sustainable’ websites. Is there a viable use case for a 2.5 MB or larger webpage? Possibly. That’s a choice every web developer, UX designer, agency, or product team needs to make. However, using this rating system, product teams can measure that decision against clear climate goals.
The system also provides unique design opportunities. Some of the best design solutions are born within specific constraints. UI/UX designers and web developers worth their salt have been optimizing pages since the web was invented. Guardrails offered by digital carbon ratings, coupled with web sustainability guidelines, can help product teams create lightweight, more accessible solutions that work across a wider range of devices, platforms, and bandwidth environments.
3. Simplicity: Using Digital Carbon Ratings for Meaningful Climate Action
Finally, using the digital carbon ratings system is very straightforward:
- Set page weight budgets for digital projects based on clear emissions targets.
- Use the system to benchmark performance for digital marketing campaigns.
- Add it to ongoing web performance optimization efforts to better align page performance with sustainability goals.
These are just a few ideas. If you find other useful ways to incorporate the ratings, we would love to hear them.
Shifting Our Own Approach to Digital Sustainability
Ecograder’s current system uses a complex algorithm that includes dozens of metrics across multiple categories to calculate a page’s overall score. Conversely, the digital carbon rating is specific to data transfer and grid carbon intensity.
While this simplicity certainly makes it easier to associate page weight with emissions, it also ignores many factors that make up a digital product or service’s overall environmental impact. This is an ongoing challenge, especially when you consider a product’s full life cycle.
However, we need aggressive climate action now. Will changing the rating system on Ecograder and related web sustainability tools to this system accelerate the change needed? We certainly hope so. At the very least, it’s another step in the right direction.
Using Digital Carbon Ratings to Accelerate Web Sustainability
The web grew to its current size because people built widely available tools that simplified the process of creating and managing digital products and services. Open source publishing tools, CMS themes, plugins, no-code or low-code authoring environments, open APIs, and so on broke down barriers to entry and offered economic opportunities to billions of people. Many companies around the world—like Mightybytes, for example—wouldn’t exist without these opportunities.
However, these tools also contributed to the web’s growing social and environmental impact. Therefore, it stands to reason that a new set of simple, easy-to-implement resources to manage and improve this impact could likewise facilitate change on a web-wide scale.
The fact that using this approach also improves user experience, performance, and access to information should, ostensibly, accelerate adoption. Web sustainability and accessibility go hand in hand.
We hope you’ll consider using this system to improve your own website or digital products. Review the digital carbon ratings post on the Sustainable Web Design site for more details.
We also welcome feedback on how best to improve these digital carbon ratings as well. Reach out via the contact form on the Sustainable Web Design site with input.
Ecograder Beta, Now with WSGs
Improve digital product or service sustainability. While still in beta, the new version now includes recommendations based on the World Wide Web Consortium’s Web Sustainability Guidelines.