Where do Digital Emissions Come From?
In this post, we discuss how to source and track digital emissions as part of a comprehensive emissions reduction strategy.
The Internet is the single biggest thing we’re going to build as a species. This is something that if we build it the right way, with the right sources of energy, could really help power our transition to renewables. If we build it the wrong way, it could actually exacerbate the problem [of climate change].
— Gary Cook, The Environmental Toll of a Netflix Binge
Digital Emissions on the Rise
Nearly 70% of the planet’s population—about 5 billion people—access the internet every day in their business and personal lives. Every single one of these interactions require electricity to function properly. Most of the internet’s power still comes from fossil fuels, which contribute to global warming.
More importantly, given the urgency with which we must address the climate emergency, organizations should implement climate-positive practices into their entire operations as quickly as possible. Yet, for most organizations, reducing emissions associated with digital products and services remains a mystery, if it is considered at all.
With that in mind, let’s explore our collective role in the rising rate of digital emissions.
Shaving off a single kilobyte in a file that is being loaded on 2 million websites reduces CO2 emissions by an estimated 2950 kg per month.
— Danny van Kooten, CO2 Emissions on the Web
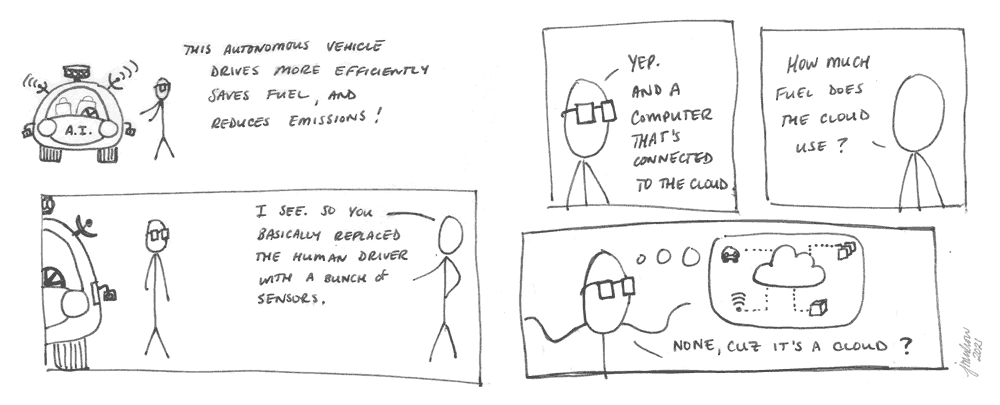
Rebound Effects and “The Cloud”
First, we don’t often consider what happens behind the scenes when interacting with the internet. We push buttons, we complete forms, and things just happen. A product shows up on our doorstep. A movie is delivered to our TV. And so on.
(At least that’s how it’s supposed to work. The reality is often a different story, but that’s another blog post.)
However, these seemingly simple interactions often trigger complex systems with thousands of servers and millions of moving parts distributed around the globe. With the internet as ubiquitous as it is for most of the world’s population, significant rebound effects occur in its widespread use. Each of these contribute to rising digital emissions. Let’s look at two such effects.
1. Jevons Paradox
The first rebound effect is based on efficiency, cost, and availability. Digital products and services have become faster, cheaper (often free), and more widely available. As a result, increased adoption and use has led to the internet’s environmental impact becoming larger than that of the commercial airline industry.
This is Jevons Paradox, a term coined in 1865 after English economist William Stanley Jevons. I wrote about it extensively in my book, Designing for Sustainability: A Guide to Building Greener Digital Products and Services. However, the primary point to consider is that improved access and efficiency often correlates to wider use and adoption.
Since improved efficiency is a common digital sustainability goal, Jevons Paradox is important to note in the context of rapidly rising digital emissions.
2. The Hidden Cost of Third-Party Services
Most modern digital products—including your website—use multiple third-party services to track and manage product operations. Yet, we rarely consider our role in producing emissions associated with our digital supply chain. It’s easy to pass the buck when everything is “in the cloud”. Out of sight, out of mind.
Common third-party digital services include:
- Ad placement and tracking
- Sharing widgets and social media platforms
- Website plug-ins
- Embedded media, such as videos, audio, etc.
- Font management services
- Analytics and performance reporting platforms
- Shopping carts, donation systems, and other applications associated with ecommerce
- CRMs, marketing automation, email marketing, chatbots, and related data management services
- And so on . . .
Each of these services may contribute only a small amount of code to an individual web page. The simplicity of setup increases their adoption rates. However, the components employed to execute their functions behind the scenes carry a significant carbon impact. Plus, they could potentially undermine a good user experience as well—as in the case of social media sharing buttons, for example.
For example, according to some estimates:
- A typical digital ad campaign can produce as much as 323 tons of CO2e.
- Using Google’s Open Bidding ad-auction platform has added up to 5,400 tons of CO2e to an advertiser’s carbon footprint.
Should Google or other ad platforms take responsibility for mitigating this impact? Absolutely. However, should your organization do the same for using their service? Of course it should.
Want to learn more about the potential carbon impact of third-party services on your own website? Check out Fershad Irani’s excellent tool, Are My Third Parties Green?
If you’re after 100% accurate figures for website carbon emissions, then you need to be able to measure the emissions attributed to processes running on a server, the energy usage of the internet required to transfer data, and the energy used by the actual device that views the website. That’s not feasible for the large majority of people who want to work out the carbon impact of their websites. And that’s why we need models to fill in the gaps.
— Fershad Irani, Adapting Cloud Carbon Footprints methodology to website carbon estimates
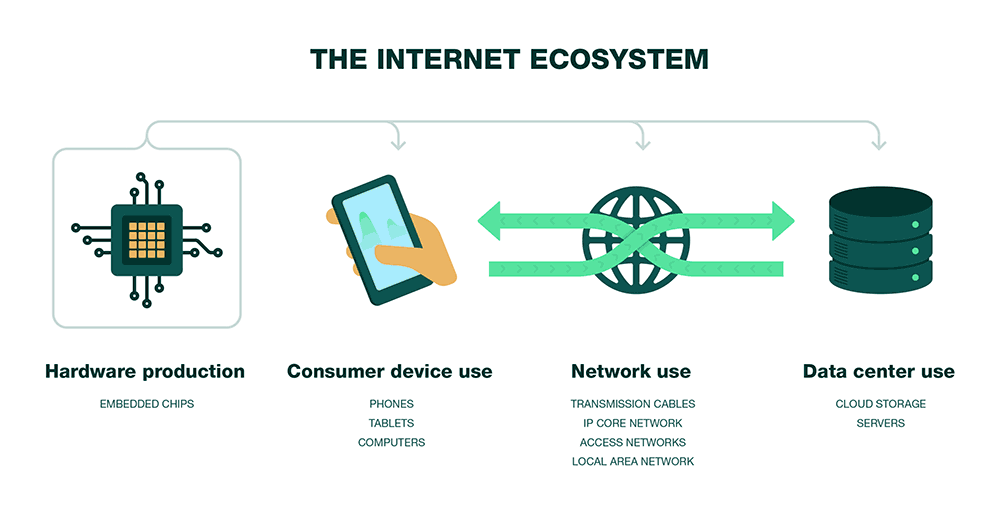
Understanding Internet Ecosystems
Digital emissions estimates from internet use fall into four categories, each of which is based on a certain amount of assumptions (see study references below). In all four of these categories, more granular data should be used whenever possible. However, this information can often be difficult to find.
1. Embedded Hardware
Every computer chip, router, or device requires energy to build. Consider including this embodied energy in estimates to account for emissions associated with hardware creation across the system.
Challenges to Estimating Embedded Hardware Emissions
- Estimates for embedded hardware often do not include other environmental impacts such as rare earth mineral mining, water use, and so on.
- Finding detailed, accurate, and up-to-date Life Cycle Assessment (LCA) data for all hardware used to power the internet is very challenging, if not close to impossible.
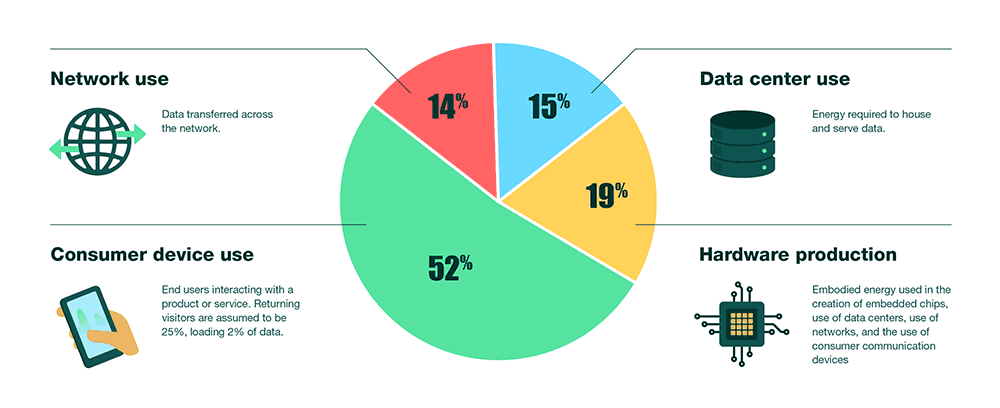
2. End User Devices
This includes smartphones, laptops, tablets, wearables, IoT devices, personal virtual assistants, assistive technologies, and so on. Emissions from end user devices represent the largest part of the system.
There are are 18.22 billion mobile devices worldwide and rising.
Challenges to Estimating End User Device Emissions
- Each device has a different energy footprint based on a variety of factors, such as systems settings, ‘dark mode’, assistive technology, and so on.
- Tracking individual device data can lead to privacy issues.
3. Networks
Next, every data request traverses a vast array of switchers, transmission cables, and networks to create value between users and the digital products they interact with. A single web page can make dozens, or even hundreds, of these requests.
Challenges to Estimating Network Emissions
- Network-related energy estimates vary based on a variety of factors: hardware, availability of renewable energy, and so on.
- Energy is often lost in data transmission, which varies from country to country based on infrastructure efficiency.
- Network device energy consumption typically operates independently from traffic load.
4. Data Centers
Data centers house and serve the assets associated with our digital products and services—images, code, media files, and so on. Plus, if you’re using a content delivery network (CDN) to serve pages more quickly, these assets are duplicated across data centers around the world.
Challenges to Estimating Data Center Emissions
- Data centers are usually closed systems. Their owners (and shareholders) don’t often want impact data released publicly.
- Energy efficiency of any given data center is typically measured by its Power Usage Effectiveness (PUE) and does not include resource use. Data centers require a lot of water to cool server banks.
Related Digital Emissions Sources
Finally, consider other related emissions sources in your organization’s overall calculations. For example, if you run an online store, transport to ship goods is a large emissions source. However, transportation is often calculated elsewhere—i.e. not as part of your digital emissions—when creating an organizational carbon footprint. To calculate specific emissions from digital products and services, the four categories above should suffice.
Sourcing Digital Emissions Data
Based on the segments above, if you know how much data your digital product serves when users request a page, you can estimate how much energy is used by various parts of the system. In turn, that data can be used to estimate digital emissions.
Page weight—the amount of data a browser must access to load a page—is the most commonly used data point, though there are others. It is also worth noting that not everyone agrees on kWh/GB of data transferred as the best way to track a digital product’s potential footprint.
Other factors also impact digital emissions estimates:
- Amount of visitors within a certain time period
- New vs. returning visitors
- Carbon intensity of the geographic region
- Number of third-party services
- And so on . . .
With that in mind, here are a few important points about the information above:
- The specific numbers in this post come from Anders S.G. Andrae’s 2020 study, New Perspectives on Internet Electricity Use in 2030. When new studies are released, we will update this information.
- The numbers herein are approximations only, included in emissions estimates to provide more well-rounded figures. Whenever possible, you should replace these numbers with more accurate data, if that is available to you.
- For a more detailed breakdown of how to estimate and track digital emissions, please read Calculating Digital Emissions, which is based on the Andrae study and several others.
- Tools like Website Carbon, EcoPing, and our own Ecograder use this approach to estimate emissions associated with your website or other digital product.
- If possible, consider a full life cycle assessment (LCA) of your digital product or service for more accurate data.
Defining Digital Emissions Scopes
Finally, emissions associated with third-party internet services fall under Scope 3. These are indirect emissions in your organization’s value chain. However, if you host your own data on internal servers, the energy purchased to power them falls under Scope 2. Boilers or other in-house combustion engines your organization uses to power its data are Scope 1.
For a truly comprehensive approach, your organization should incorporate all three emissions scopes into its overall climate strategy.
Scope 3 emissions are the most difficult to grapple with but that’s where the action has to happen – that’s also where marketing and advertising plays a powerful role. Not only in helping to drive solution-focused values/mindsets, but also in driving the success of critical brand initiatives that rely on customers to engage with new infrastructures (such as circular economy calls to action/process).
— Laura Costello, What Does the IPCC Report Mean for Brands and Agencies?
Reduction Strategies for Digital Emissions
If you can measure it, you can reduce it. While measuring digital emissions is challenging due to the vast number of moving parts involved, tools and practices are emerging to help organizations make sense of their approach.
A lower impact internet ecosystem will incorporate these practices into the categories listed above:
- Hardware Production: Use circular design practices in hardware production and reduce e-waste.
- Consumer Devices: Reduce the amount of data loaded on user devices by incorporating sustainable web design practices when creating digital products and services.
- Network Use: Reduce the amount of data transferred over the network via the same practices.
- Data Centers: Power the servers with renewable energy, improve PUE, and use emerging technologies to improve efficiency.
To get started within your organization:
- Set a baseline: Understand where you are right now to learn how best to improve. This might mean running a sustainability audit on one of your digital products or services.
- Define a reduction strategy: Use the baseline to inform a comprehensive emissions reduction plan.
- Iterate: Make small, incremental changes, measuring as you go, to improve your performance and reduce digital emissions over time.
This simplifies what can be a complex and time-consuming process. However, the more you do it, the more natural it will become.
To move towards a grid completely powered by renewables this sector needs to be pushing governments to say we want renewable energy as it is critical for our business, we need to be getting in the policy space as well as the procurement space…So that in 10 years time we are looking at an Internet infrastructure that is 100 percent powered by renewable energy.
— Gary Cook, Greenpeace
An Emissions-Free Internet by 2030
Even if every organization began reducing their emissions and purchasing 100% renewable energy today, an emissions-free world is still quite far off. We also need laws and incentives that reward climate-positive behaviors and punish high-emissions companies and industries.
Plus, climate justice isn’t only about reducing emissions. We must provide equitable solutions that help the people and communities who are most affected by climate change. By advocating for more responsible climate legislation in the jurisdictions where your organization operates, you can help us collectively move toward an economy that works for all people and our shared planet.
This includes powering our digital infrastructure by renewable energy and using it to advance sustainability goals rather than fuel injustice. The clock is ticking. Why not get started today?

Sustainability Services
Learn how Mightybytes helps our clients align digital initiatives with comprehensive sustainability strategies for more meaningful outcomes.