Is Your Google Analytics Set Up Correctly?

Here are a few simple checks that will reveal whether your Google Analytics account has common configuration issues.
90% of the Google Analytics accounts we audit at Mightybytes have serious issues. So, we want to help you check whether yours does too. Think of this as your Google Analytics ‘check engine’ light.
Log into your Google Analytics account (or find the person who’s handling it) and let’s run your check together.
Disclaimer: Most businesses fail some (or all) of these checks. Don’t feel bad if you do too.
Check #1: Bad Data
Your data’s bad. I know your data’s bad before you run your check because all web analytics data is bad.
Avinash Kaushik, a prominent analytics expert and Digital Marketing Evangelist for Google wrote on his blog:
Data quality on the internet absolutely sucks. And there is nothing you can do about it.
There are simply too many ways data goes wrong that Google can’t figure out what’s happening with 100% certainty.
The question we need to answer is not whether you have bad data. Instead, we need to figure out whether your data problems are preventing you from making smart data-driven decisions.
For example, imagine if last month your data showed that you had 2,384 visitors from social but the real number of visitors was 2,579. Would that difference change your decision making process? It shouldn’t.
On the other hand, if your analytics show that your social traffic makes up 10% of your traffic but the real percentage is 30%, that can change your decision making process.
Here’s my favorite check for this.
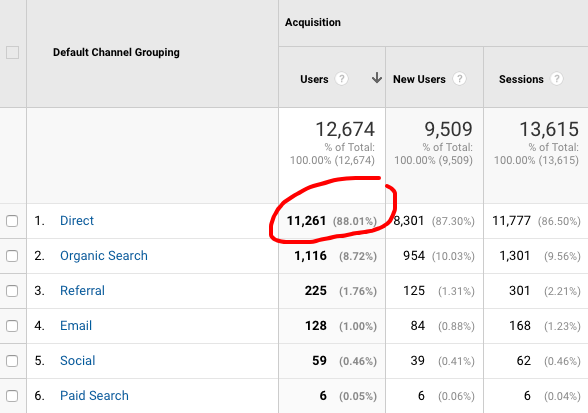
Direct Traffic > 20%
This is a trick I learned from Paul Koks at online-metrics.com. If your direct traffic makes up more than 20–25% of your site traffic, most of the time that means there are issues fundamentally affecting your topline metrics.
Check here:
- Go to Acquisition > Channels > Direct
- Check the percent of Users, New Users, and Sessions
- If direct makes more than 20%, that’s a warning sign
What it could mean:
- A lot of your promotion might be happening offline (brochures, print ads, etc.) That traffic might not be registering correctly. Consider using a vanity domain & utm parameters to tell Google Analytics who is coming from print.
- Some of your social and email traffic isn’t being categorized correctly. Consider auditing your marketing communication for utm parameters.
- You have a spam traffic problem. Consider checking the common indicators of spam traffic to identify how to best handle the issue.
- Your domain name is similar to and mistaken for a different company. Consider adding a segment that removes homepage visitors who have a session duration = 0 seconds.
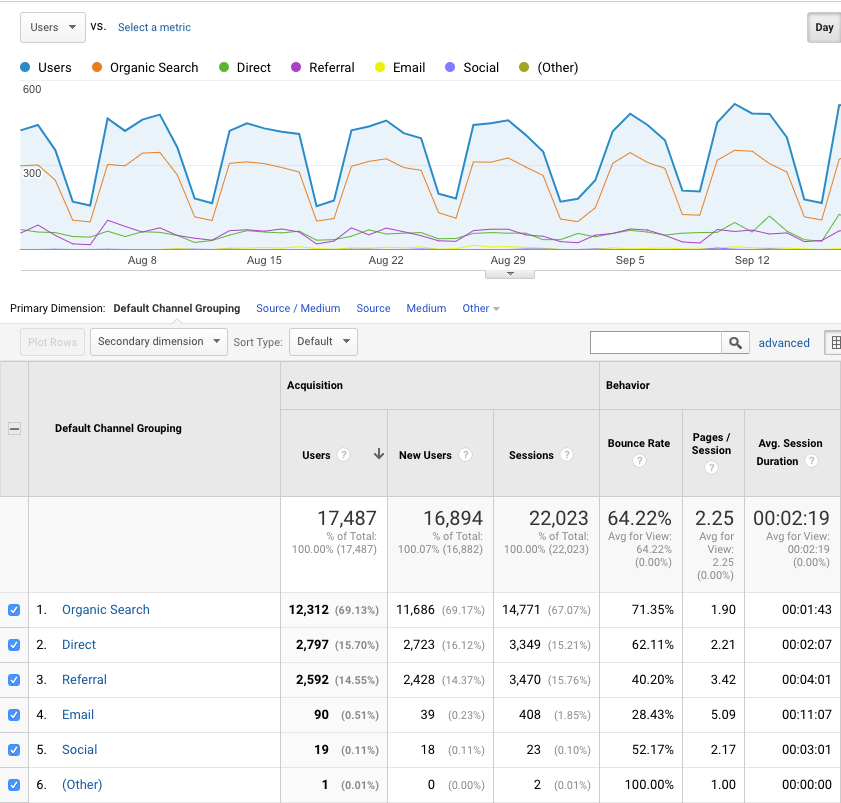
Channel Gut Check
You should have a general feeling for where your visitors are coming from. You know how much time you’re spending on social media and how many impressions, likes, and clicks you’re getting. You know how much money you’re spending on paid media. You know whether you’re prioritizing content marketing and SEO. Sometimes if a number feels wrong, it’s worthy of further investigation.
Check here:
- Go to Acquisition > Channels
- Are there any channels that are missing? Any channels getting a surprisingly large or small amount of traffic?
- Check the checkbox for all channels > Click “Plot Rows”
- Are there any unexpected patterns?
Check #2: Data Risk
Have you ever heard the story of the junior developer who accidentally deleted the company’s production database on his first day? Or how a big chunk of Toy Story 2 was accidentally deleted during development? Or have you ever had a term paper disappear when your laptop died?
How secure is your Google Analytics data? Let’s check.
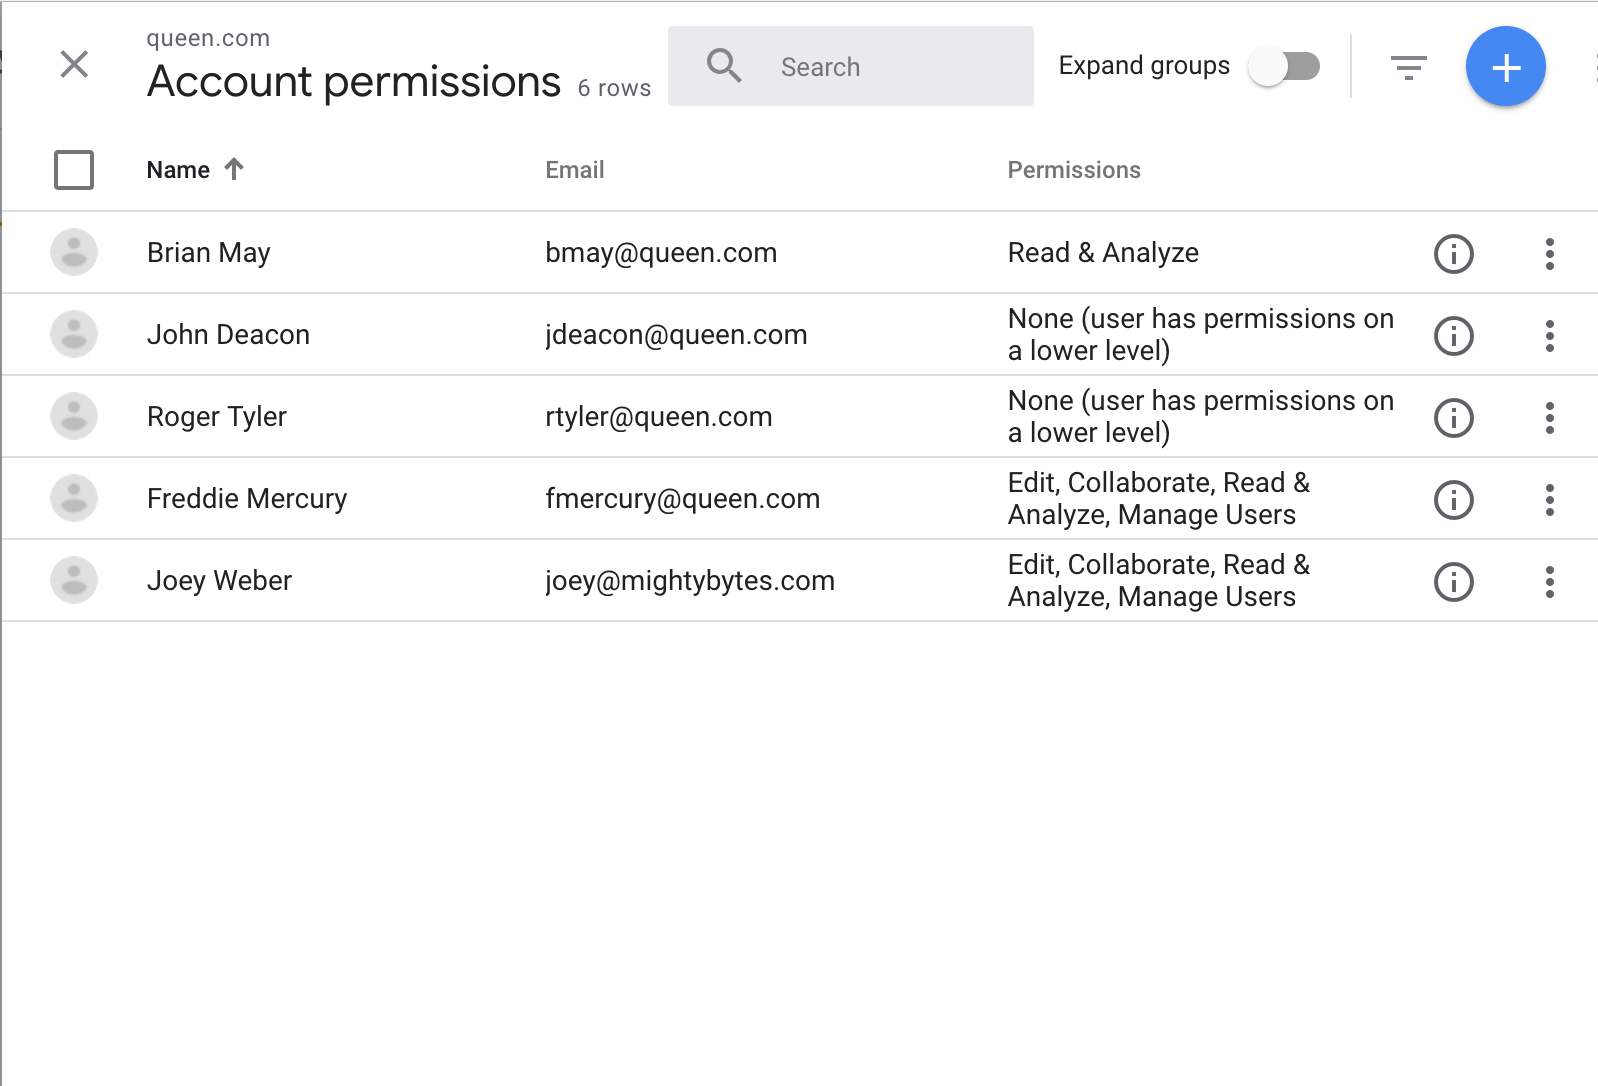
Risky Permissions
Do you know whether you can trust everyone who has admin access to your analytics data? Has anyone ever given access to an old freelancer or agency? Can any former employees access your Google Analytics account?
It’s incredibly common for people to have full admin access to Google Analytics accounts that shouldn’t have it anymore. Not only can those people see all your data, but in many cases they can delete or corrupt it.
Check here:
- Go to Admin > Account > User Management
- Anyone with “Edit” access can screw up your data
- Anyone with “Manage Users” can screw up your user access
- Consider giving “Edit” access only to individual views or properties to restrict permission issues
No Pure Views. No Test Views.
It’s surprisingly easy to accidentally screw up data in Google Analytics. There are many things you can do in analytics that will permanently corrupt your data. To guard against risk, all Google Analytics accounts should have at least one raw data view and one test view.
- A raw data view should be untouched with no data applied. This is your fall back. If everything else goes wrong, you’ll still have uncorrupted data. Restrict the access to your raw data view to whoever you trust the most.
- A test view is where you experiment with filters and goals before applying them to your primary view. It’s important to test anything that’s going to alter data before you do it and a test view is where you can do it.
Check #3: Data Naming
The data in Google Analytics is tricky to understand by itself. It get more difficult when there isn’t a thoughtful plan for consistent names and labels. For example, in one recent account I audited, I found the following goals:
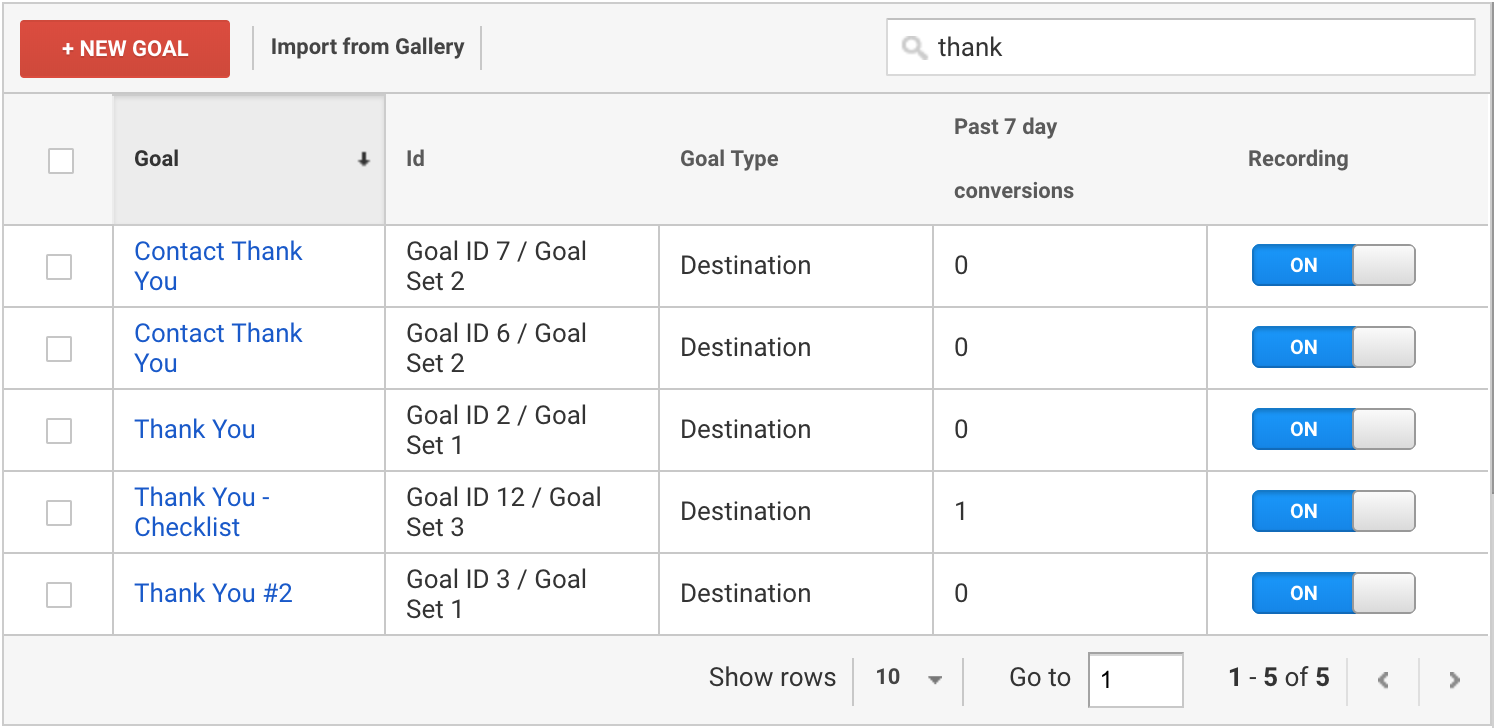
This sort of thing makes analysis much more difficult. It’s important to have a good goal strategy and consistent naming conventions.
Here are the key areas to check:
- Views – Is it obvious what each view is for? Which one you should review?
- Property – Is it obvious what the website is?
- Account – Is it obvious what company/organization owns these analytics?
- Goals – Is it clear what each goal is by its name? If there are multiple similar goals, is it clear which is which?
- Filters – Is it clear which filter does what?
- Events – Is there a consistent naming strategy for event categories, event actions, and event labels?
- Mediums – If you have non-standard mediums in your data, is it clear what they represent? Is it clear how they’re different from the standard mediums?
- Cases – Do you have a mix of uppercase and lowercase throughout your account? If there is a mix, is it predictable?
This is a Good Start
You can study for years and never reach the end of your Google Analytics account. There are always more things to fix and ways to organize more effectively.
You can get into all of that eventually, but for now, this is a good start.
Run these checks let us know what you find. Are you part of the 10% of businesses who pass these checks? Congrats! Are you part of the 90% and need to make some changes? Don’t feel bad. You’re in good company. Once you’ve cleaned up your Analytics account, you’ll be ready to analyze real data and track your marketing funnel.
If you want your data to be clear, clean, and easier to understand, we can help with that. We run a 60+ point analytics audit and implementation plan so we can get you squared away. If that sounds like it might be helpful, send us an email, hit us up on Twitter @mightybytes, or find one of us over on LinkedIn, and we can chat.